An analog signal is read by the Atmega328p, then sent to the HC-05 Bluetooth module via UART. On the PC, the incoming data is processed by a Python script and plotted using matplotlib.
On another approach, the values are continuously stored to a .csv file and read + plotted by a second script.
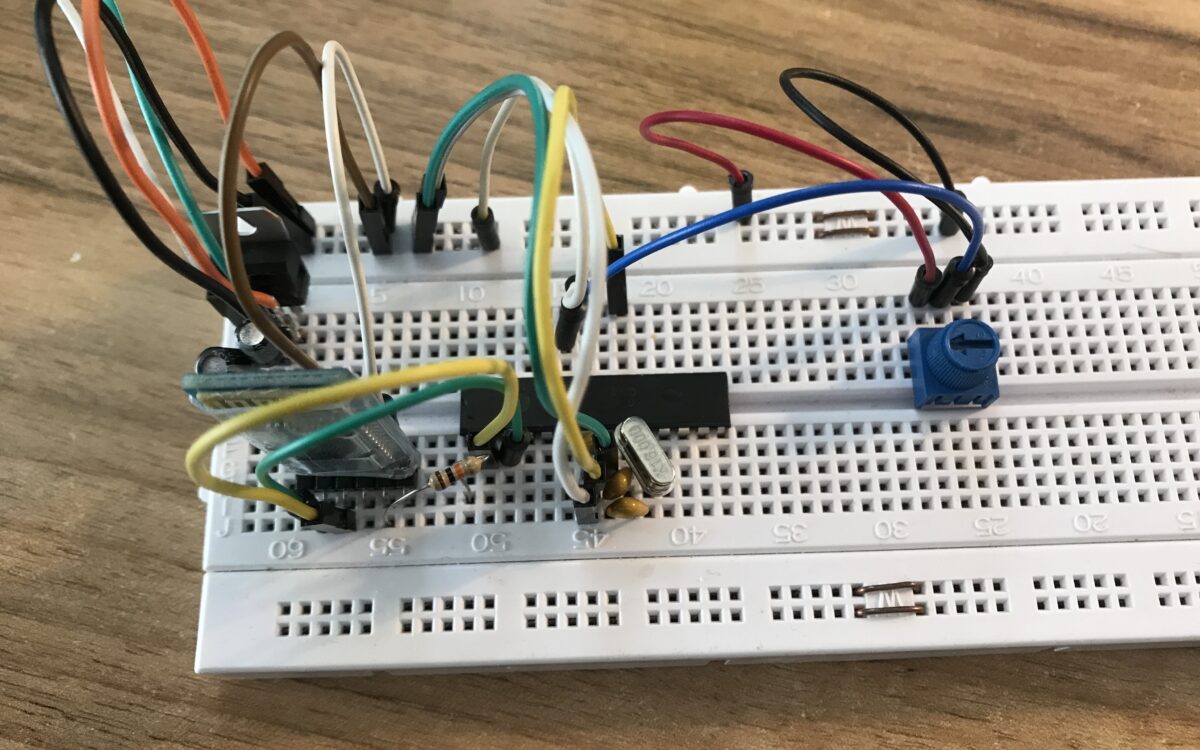
Schematic

The programming was done in Microchip Studio, using an USBasp programmer and AVRDude Assistant GUI.
Code AVR
|
1 2 3 4 5 6 7 8 9 10 11 12 13 14 15 16 17 18 19 20 21 22 23 24 25 26 27 28 29 30 31 32 33 34 35 36 37 38 39 40 41 42 43 44 45 46 47 |
#define F_CPU 16000000L #include <avr/io.h> #include <avr/interrupt.h> #include <avr/pgmspace.h> #include <stdlib.h> #include <util/delay.h> #include "uart.h" //http://www.peterfleury.epizy.com/avr-software.html#libs #define UART_BAUD_RATE 115200 int adc_read(char channel) { unsigned int a = 0, result = 0; ADMUX |= channel; ADCL = 0x00; ADCSRA |= (1 << ADSC); DIDR0 = (1 << channel); while ((ADCSRA & 0x40) != 0){ } a = ADCL; result = ADCH; result = result << 8; result = result | a; return result; } void adc_init() { ADMUX = (1 << REFS0); ADCSRA = (1 << ADEN) | (1 << ADPS2);// | (1 << ADPS1) | (1 << ADPS0); } int main(void) { char buffer[8]; int val_adc = 0; adc_init(); uart_init(UART_BAUD_SELECT(UART_BAUD_RATE,F_CPU)); sei(); while (1) { val_adc = adc_read(0); itoa(val_adc, buffer, 10); uart_puts(buffer); uart_puts("\n"); _delay_ms(50); } } |
Python code approach 1
The baudrate of the HC-05 Bluetooth module has to be set correctly via AT-commands, e.g. to 115200. Default password is something like ‘0000’ or ‘1234’ when connecting to windows. The used COM-Port can be identified in the device manager.
|
1 2 3 4 5 6 7 8 9 10 11 12 13 14 15 16 17 18 19 20 21 22 23 24 25 26 27 28 29 30 31 |
import serial import time import matplotlib.pyplot as plt from itertools import count from matplotlib.animation import FuncAnimation plt.style.use('fivethirtyeight') x_vals = [] y_vals = [] index = count() def animate(i): rl = ser.readline() if rl: my_data = int((rl).decode('utf-8')) x_vals.append(next(index)) y_vals.append(my_data) plt.cla() plt.plot(x_vals[-60:], y_vals[-60:]) comport = input("COM Port (number only): ") baudrate = input("Baudrate: ") print('Initializing connection, please wait...') ser = serial.Serial('COM' + str(comport), baudrate, timeout=None, xonxoff=False, rtscts=False, dsrdtr=False) ani = FuncAnimation(plt.gcf(), animate, interval=100) plt.show() |
The readline() method is slow and the limiting factor here. So depending on how fast the 328p transmits the data, there could be a certain delay until changes in the displayed plot are visible after turning the potentiometer.
Python code approach 2
Now implementing a faster way of reading the serial data that I found on github.
|
1 2 3 4 5 6 7 8 9 10 11 12 13 14 15 16 17 18 19 20 21 22 23 24 25 26 27 28 29 30 31 |
import serial class ReadLine: def __init__(self, s): self.buf = bytearray() self.s = s def readline(self): i = self.buf.find(b"\n") if i >= 0: r = self.buf[:i + 1] self.buf = self.buf[i + 1:] return r while True: i = max(1, min(2048, self.s.in_waiting)) data = self.s.read(i) i = data.find(b"\n") if i >= 0: r = self.buf + data[:i + 1] self.buf[0:] = data[i + 1:] return r else: self.buf.extend(data) ser = serial.Serial('COM10', 115200) rl = ReadLine(ser) while True: print(int(rl.readline())) |
The above minimum example works great and prints the ADC values super fast and very reliable.
However, upon adding the remaining code for plotting, problems start to occur.
|
1 2 3 4 5 6 7 8 9 10 11 12 13 14 15 16 17 18 19 20 21 22 23 24 25 26 27 28 29 30 31 32 33 34 35 36 37 38 39 40 41 42 43 44 45 46 47 48 49 50 51 |
import serial import matplotlib.pyplot as plt from itertools import count from matplotlib.animation import FuncAnimation plt.style.use('fivethirtyeight') x_vals = [] y_vals = [] index = count() class ReadLine: def __init__(self, s): self.buf = bytearray() self.s = s def readline(self): i = self.buf.find(b"\n") if i >= 0: r = self.buf[:i + 1] self.buf = self.buf[i + 1:] return r while True: i = max(1, min(2048, self.s.in_waiting)) data = self.s.read(i) i = data.find(b"\n") if i >= 0: r = self.buf + data[:i + 1] self.buf[0:] = data[i + 1:] return r else: self.buf.extend(data) def animate(i): rl = ReadLine(ser) my_data = int(rl.readline()) x_vals.append(next(index)) y_vals.append(my_data) plt.cla() plt.plot(x_vals[-60:], y_vals[-60:]) comport = input("COM Port (number only): ") baudrate = input("Baudrate: ") print('Initializing connection, please wait...') ser = serial.Serial('COM' + str(comport), baudrate, timeout=None, xonxoff=False, rtscts=False, dsrdtr=False) ani = FuncAnimation(plt.gcf(), animate, interval=100) plt.tight_layout() plt.show() |
The ADC values sometimes jumps significantly, even when e.g. the ADC0 Port is connected to the fixed voltage of 3.3V. Also, sometimes an empty byte is read and therefore throws a ValueError when trying to convert it to int. Both things didn’t happen with approach 1.
Continuously save to .csv and live-plot from there
Two separate scripts are used, the first reads the serial data and writes it to a .csv file, the second script reads from the continuously updated .csv file and plots it. The scripts can be manually started via the terminal, or a by a short bash script that executes them both.
|
1 2 |
python script1.py & python script2.py & |
First script reading the serial data and writing it to the .csv file. (CTRL+C to stop the process)
|
1 2 3 4 5 6 7 8 9 10 11 12 13 14 15 16 17 18 19 20 21 22 23 24 25 26 27 28 29 30 31 |
import csv import serial x_value = 0 y_value = 0 fieldnames = ["x_value", "y_value"] with open('data.csv', 'w') as csv_file: csv_writer = csv.DictWriter(csv_file, fieldnames=fieldnames) csv_writer.writeheader() comport = input("COM Port (number only): ") baudrate = input("Baudrate: ") print('Initializing connection, please wait...') ser = serial.Serial('COM' + str(comport), baudrate, timeout=None, xonxoff=False, rtscts=False, dsrdtr=False) while True: with open('data.csv', 'a') as csv_file: csv_writer = csv.DictWriter(csv_file, fieldnames=fieldnames) info = { "x_value": x_value, "y_value": y_value, } csv_writer.writerow(info) print(x_value, y_value) rl = ser.readline() x_value += 1 y_value = int(rl.decode('utf-8')) |
The main script reads the data from the .csv and plots it.
|
1 2 3 4 5 6 7 8 9 10 11 12 13 14 15 16 17 18 19 20 21 22 23 24 25 26 27 28 29 30 31 32 |
import serial import time import matplotlib.pyplot as plt from itertools import count from matplotlib.animation import FuncAnimation plt.style.use('fivethirtyeight') x_vals = [] y_vals = [] index = count() def animate(i): rl = ser.readline() if rl: my_data = int((rl).decode('utf-8')) x_vals.append(next(index)) y_vals.append(my_data) plt.cla() plt.plot(x_vals[-60:], y_vals[-60:]) comport = input("COM Port (number only): ") baudrate = input("Baudrate: ") print('Initializing connection, please wait...') ser = serial.Serial('COM' + str(comport), baudrate, timeout=None, xonxoff=False, rtscts=False, dsrdtr=False) ani = FuncAnimation(plt.gcf(), animate, interval=100) plt.show() |
Conclusion
- I tried the same procedure with the HM-10 Bluetooth module, but windows won’t assign an COM-Port. Apparently, windows does not support pairing with BLE modules. Thanks Obama.
- The readline() method is slow. Like really slow. There is a faster alternative from ‘skoehler’ here https://github.com/pyserial/pyserial/issues/216
- For me, the faster readline() mentioned above works great in a standalone setup. But as soon as I add all the plotting code around it, it doesn’t work properly anymore. E.g. Values jumping around and many empty bytes received and ValueErrors when trying to convert them to int and so on.
- I somehow wanted to bypass the problem by writing the incoming data directly into a .csv file and then create a plot that continuously reads from that very same .csv file. This has two advantages: It stores the measured data and also verifies the data at the same time, since the data for the continuously updating plot is read from that .csv file. But for reading the serial data again some kind of Python serial.read method had to be used and the code with the faster alternative started to deliver weird values upon speed increase as mentioned above.